Introduction
Front End servers tend to be running 'in the field' and seldom require user input or intervention. Nevertheless, situations arise where a server needs to be accessed (for instance to check local conditions) or to be restarted. It is in fact true, that the current on-going server statistics can be an invaluable debugging tool, when trying to pin down hard-to-find connectivity problems, etc. To this end TINE offers numerous remote servers to the controls administrator or front end developer.
On the one hand, all TINE servers offer a set of so-called STOCK properties, many of which deliver (per TINE protocol) all of the pertinent server statistics and activities. On the other hand, when a server is 'hung' or can otherwise not be reached via the normal TINE protocol, trying to restart the server via the TINE protocol would be useless, since it would be guaranteed not to work under these conditions. In such cases an independent means of remotely restarting the server is what is called for. And the solution to the 'remote restart' problem is frequently platform dependent. We shall discuss these platform dependent techniques for remote restart and well as remote 'control' in more detail below.
Statistics
All TINE servers offer the stock properties which let the caller pull information up from the server. Among these stock properties are the trivial properties SRVDESC, SRVLOCATION, SRVOS, and SRVVERSION which offer static information cached at startup time, namely the server's description, physical location, operating system, and TINE version respectively.
Running time information such as the server's current working directory can be obtained via the stock property SRVCWD and the server's startup command line via SRVCMDLINE. In addition, a caller can obtain security information as to the list of users with WRITE access and the list of networks with WRITE access by calling the stock properties USERS and IPNETS, respectively. The 100 most recent commands send to the server can be gleaned via the stock property SRVCOMMANDS.
More interesting is the dynamic information obtained by calling the stock properties ACTIVITY and SRVSTATS. A call to ACTIVITY must ask for an ActivityQueryStruct structure with TINE data type CF_STRUCT. An ActivityQueryStruct looks like:
We see that the information returned is general information concerning server operation. For instance the server's startup time and the server's current clock time, along with the current number of registered contracts and clients in the server's connection tables. General counters refering to the server's network activity are also available, such as the number of UDP, TCP, IPX packets received at the server, etc. If the server is itself a client, then the number of connection arrivals and timeouts is also presented inside the structure information.
A more detailed analysis of the server's activity since startup is offered by the stock property SRVSTATS. As the information provided consists entirely of 32-bit integer counters, this property can and should be called with the TINE datatype of CF_INT32. The information returned is shown in the structure below:
Before we launch into a discussion as to what all of these parameters mean, we note that these statistics can be pulled from a server via calling the stock properties or by typing get stats at the command line (for console servers running in the foreground or via the attachfec tool for servers running in the background or as a service). An example output of get stats is shown below:
We now note that contract misses and contract delays indicate communications problems on the server-side. Specifically, when the server sees that it is scheduling communication to a client at a rate greater than twice the requested transmission rate, it records a 'miss'. When the server tries to schedule a contract request, but notices that output from the previous request to the same contract is still pending, it records a 'delay'. When the server notices that it is delivering data after then client-specified polling rate or time out has expired, it increments the client 'miss' counter. In each of these cases this indicates a busy server, and these values should be as low as possible.
When a client request a value and the CM_RETRY flag is set, the server increments the client 'retry' counter. Likewise if a client unexpectedly renews a contract subscription (indicating it missed a delivery) the server increments the client 'reconnect' counter. These values can be indicative of busy clients or busy networks.
The synchronous calls indicator can be examined to get an idea of how client applications are making use of the server.
The number of 'bursts' is the number of times that the server has reached its burst limit while sending data packets.
Counters such as 'connection timeouts' and 'incomplete transfers' are client-side counters.
The CPU usage refers to a 'best guess' calculation of a server's busy time versus its idle time.
Cycles/sec refers to passes through SystemCycle(). For DOS machines these numbers should be high. For all other platforms these values reflect the system polling rate. The maximum value gives the most passes through SystemCycle in one second since server startup, and could be a large number if the server has ever been accessed via numerous repetitive synchronous calls for instance. The average number is actually the most recent number of passes through SystemCycle per second.
Many of the other stats give configuration parameters, most of which can be adjusted if necessary.
A TINE statistics server can be configured to collect and keep histories of some of the more important counters from designated servers. In addition, the statistics server itself can maintain timeout counters, etc. as well as obtain information from the equipment name server as to the number of reboot history of a server. Generally, the statistics server will add any unmonitored IMPORTANT servers to its database upon a restart.
For instance, consider the display of the timeout counts as measured by the statistics server:
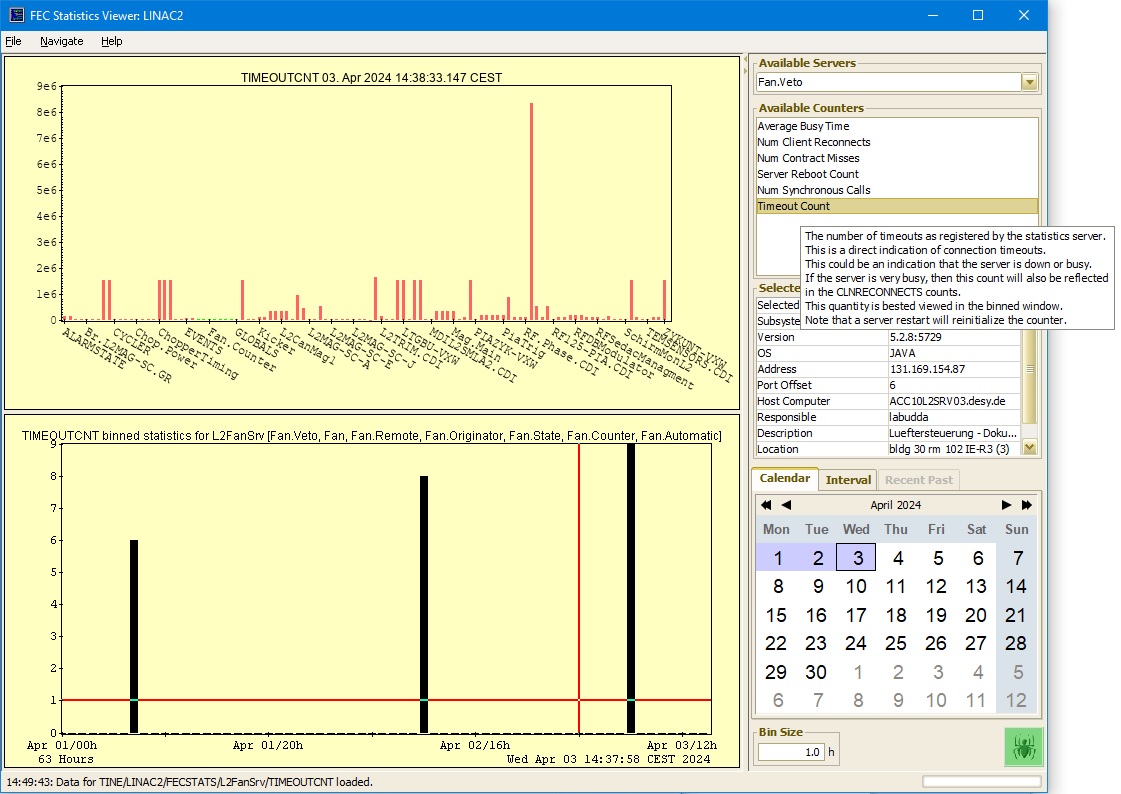
In the display, instead of a trend, it makes the most sense to view the data as binned output since the timeout counter will monotonically increase over the course of the year.
The timeout counter is only an indication of the connection timeouts seen by the statistics server itself and does not necessarily mean that the server was down. Connection timeouts could arise due to network problems or a very busy server. To help decide where the root of the problem is, the other statistics should be consulted over the same time span.
For instance, consider the display of the reboot counts as obtained from the equipment name server:
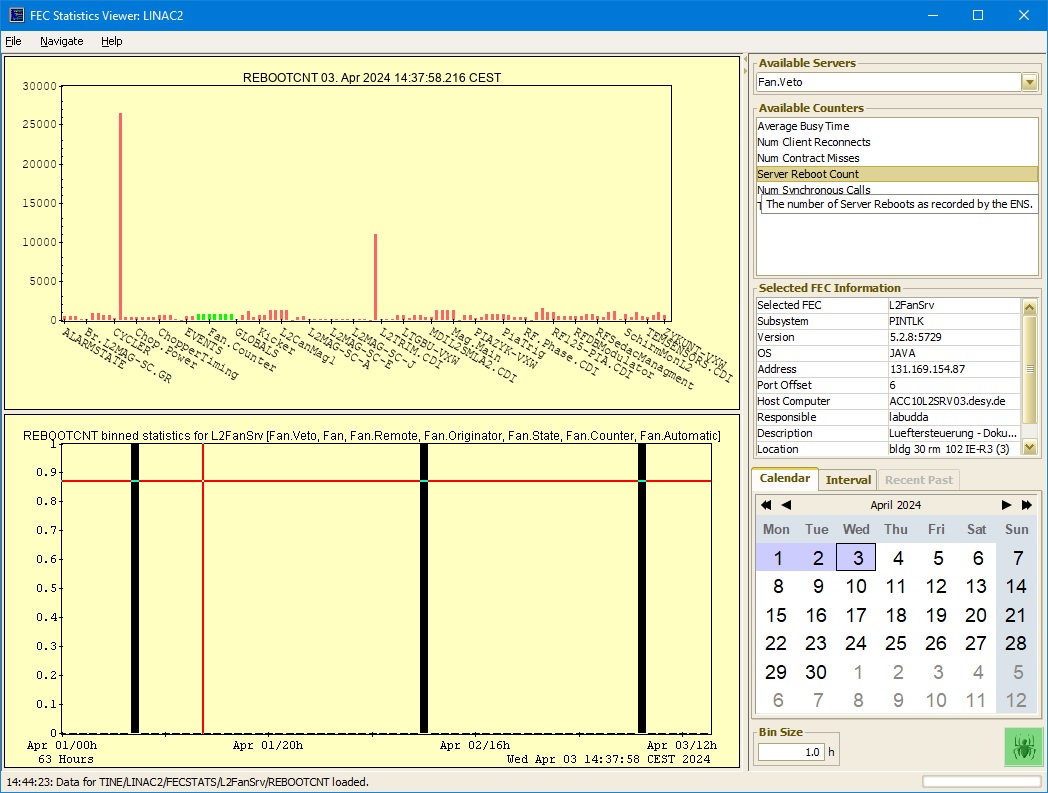
This gives the number of times the server was restarted over the time span in question. Note that a server could have been down for hours before a restart, or could have been restarted from a running state. The equipment name server simply keeps track of the number of restarts.
Now consider the display of the client reconnects as obtained directly from the server in question.
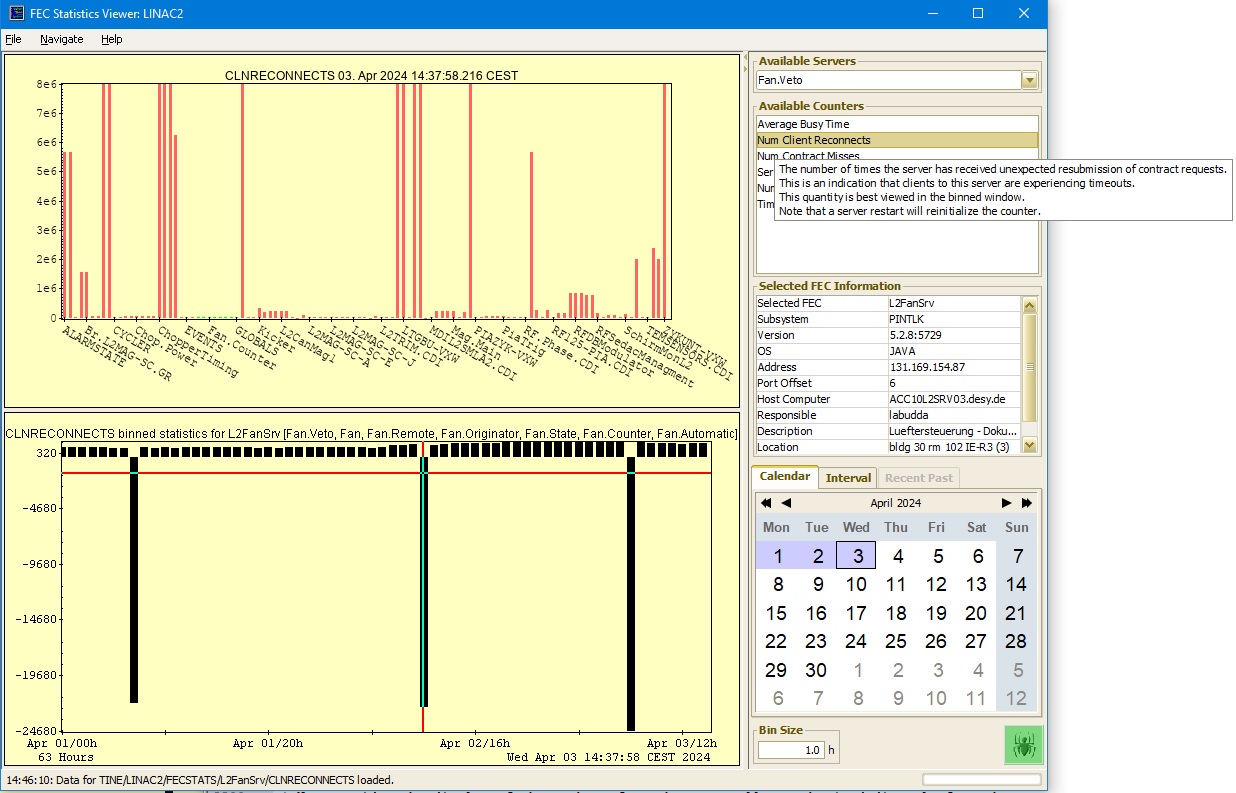
This gives an indication as to how often a server's clients are seeing timeouts and are thus forced to re-establish their data links. If this number is high, it is a sure indication that there is either a network problem or that the server is unduly busy.
Now consider the display of the contract misses as obtained directly from the server in question.
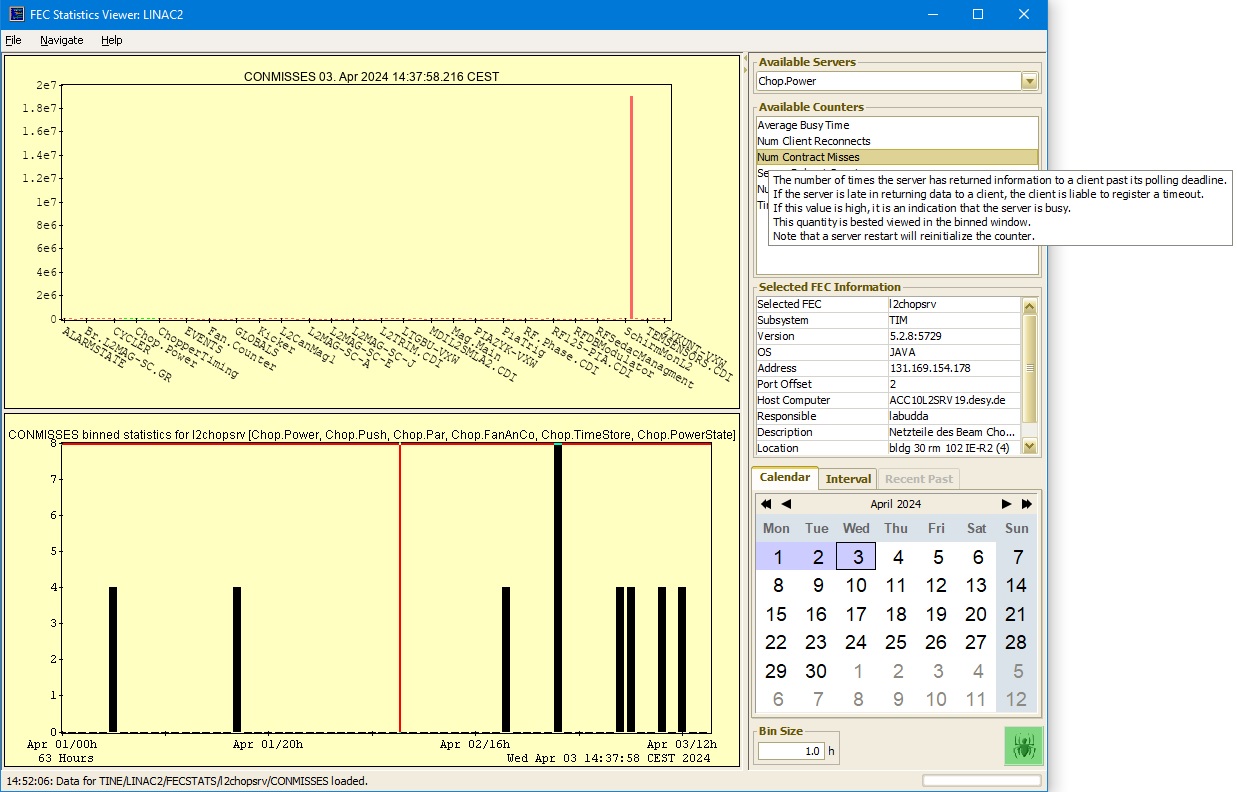
This gives an indication of how often a server is returning late contracts. If this correlates well with the number of client reconnects, then it is a sure indication that the primary reason for clients receiving connection timeouts is that the server is busy.
Now consider the display of the number of synchronous calls as obtained directly from the server in question.
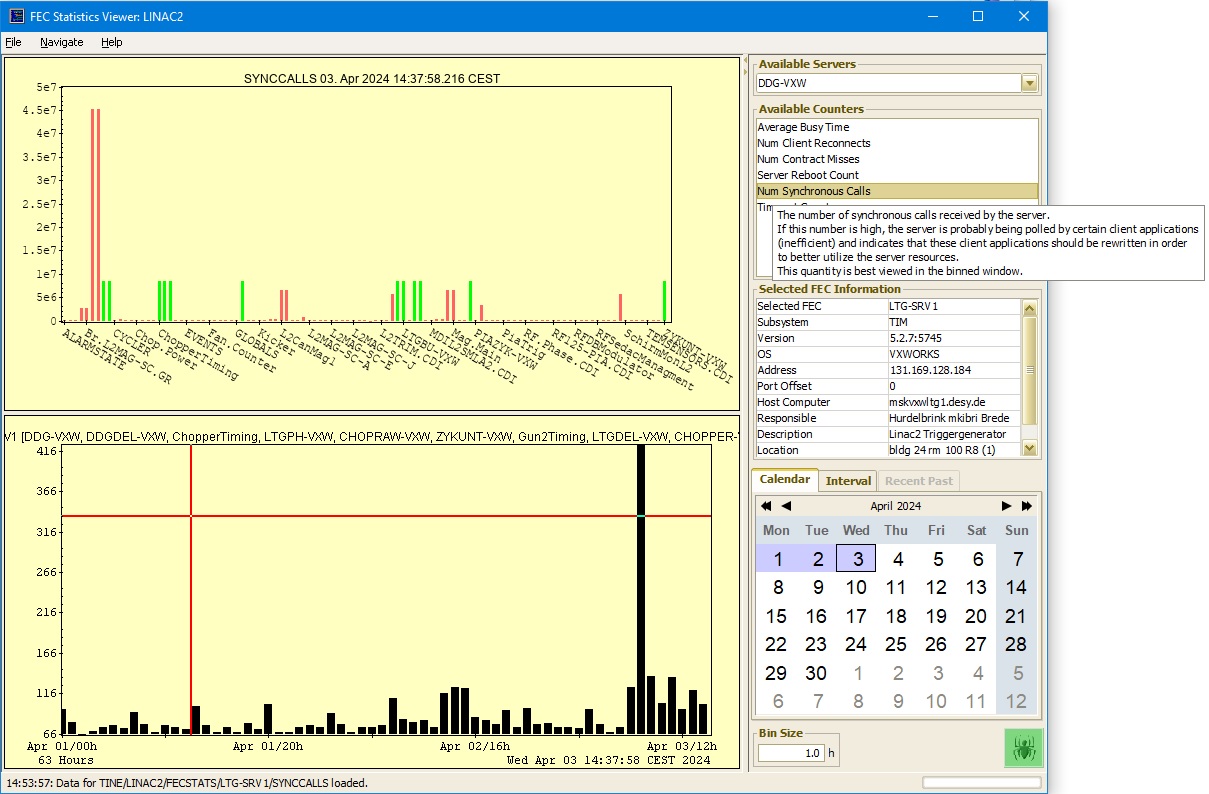
If this number is high, it generally means that poorly written clients (or scripts) are synchronously polling the server for data. This is the least efficient way of obtaining data from a server, and if the same client program is run at many stations this could generate an unnecessarily high load on the server and could be one reason why the server is busy.
Finally, consider the display of the average busy time as obtained directly from the server in question.
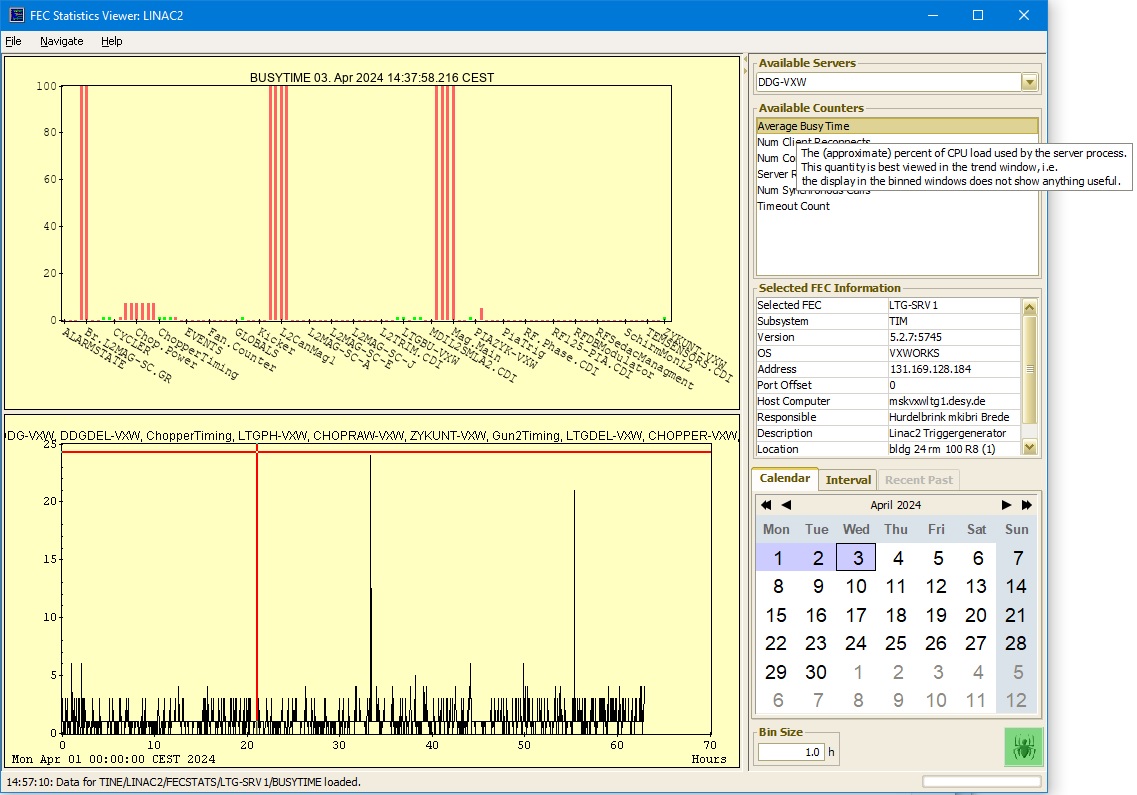
This statistic gives an estimate of percentage of the cpu load used by the server thread. It is best viewed as a trend and makes little sense as a binned statistic. This statistic should be regarded approximate and reflects the amount of time spent 'doing something' versus the server idle time.
Also of potential interest are the performance settings (particularly if performance problems are being investigated). At the console (or via the 'attachfec' tool) one can type 'get settings' and view an output such as the following:
which provides the user with information concerning working buffer lengths, threading information, socket and transport information, and so on.
Log Files
All TINE servers maintain a log file called fec.log, which is rotated into fec.bak when the allowed file size has been exceeded. By default this log file is kept on the local disk for those platforms which typically have a disk, otherwise the log file is kept in main memory as a ring buffer (and will consequently disappear if the server is restarted). In any event the log file can be pulled from the server by calling the stock property LOGFILE. This not only allows a control system administrator to be able to access all servers' log files at a central location (without worrying about file mounts) it also allows secondary processes to periodically pull the log files from those servers which do not have disks and store them on a file system elsewhere.
In addition, independent the log files commands.log and errors.log are also maintained and rotated (once with a .bak extension).
Tools
The primary management tool for making use of the remote servers offered by TINE servers is the FEC Remote control application shown below.
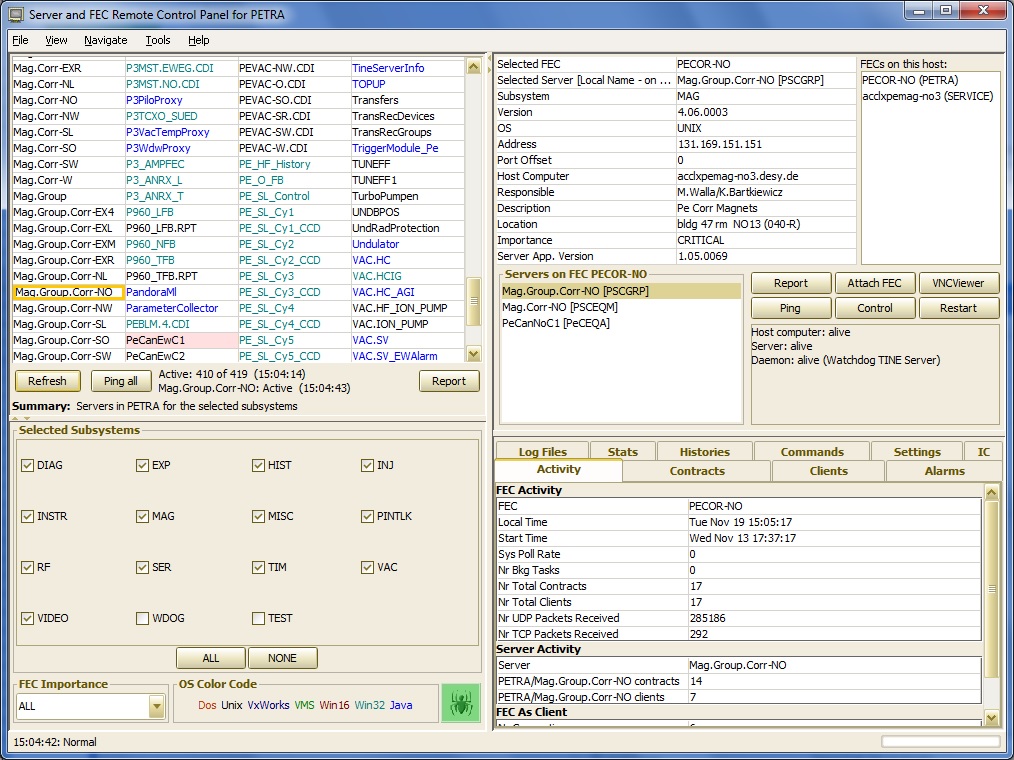
The view shown above is trained on the PETRA machine and one can see at a glance the number of different platforms (all speaking TINE) involved at the front end.
As seen from the buttons offered, one of the services offered from this control program is the ability to 'restart' the front end process in question. Another service is the ability to 'control' the front end process in question. These services require a bit of explanation.
The first thing to note is that the ability to either 'control' or 'restart' a front end process is platform dependent, and the level or amount of 'control' will vary depending on the platform. We shall discuss these case by case below.
UNIX and WINDOWS
The solution used in the case of both Unix servers (especially including Linux) and Windows servers is to make use of the TINE watchdog server, which can manage all manner of processes on the machine in question and offer an independent remote port for accepting commands.
Thus 'restarting' a server process determines that the operating system is UNIX or Windows and then issues a command to the TINE watchdog giving it the name of the front end process to restart. This must be the same as the FEC name, which identifies the server process at the control system level.
Controlling the process amounts to launching an attachfec to the remote server. Once attachfec has connected to the server, you can supply all available console commands as if the server were running in the foreground.
The above method makes use of a remote debugging socket to attach to the target server. Alternatively, a local attachfec process can make use of a named pipe to attach to the server process.
This attachfec program is itself part of the TINE package and can be built for the target platform by using the attachfec.mak make file. If you logged under the same account which owns the server processes, then the attachfec program can attach into a named pipe started by the server. You can then have the full panoply of console command at your disposal as if the server were running in the foreground.
Note that by issuing a quit you quit the attachfec session and not the server process. You can stop the server process from an attachfec session by issuing a 'kill' command. This in fact is one way to gracefully close a server process.
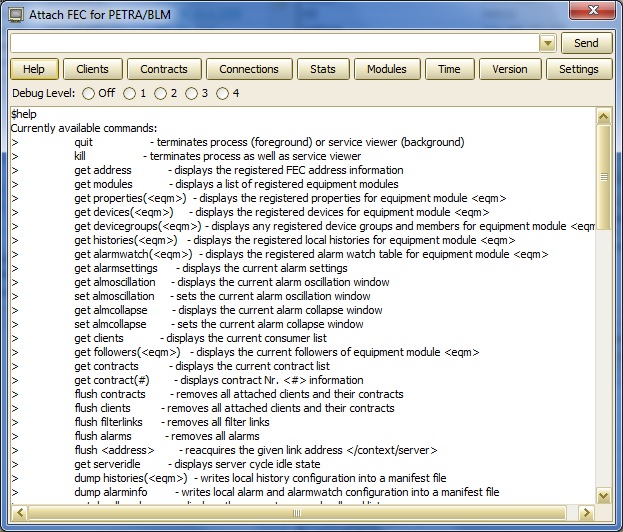
attachfec is a powerful tool for investigating the activity of a TINE server. Simply typing 'attachfec' at the command line will produce the following output:
In which case, we notice that we can also attach to any running fec process anywhere by providing the input in the form of "/<context>/<server>" which is a signal to resolve the host address and attach to a special debug stream socket, which will work regardless of the platform of the remote host (provided that the TINE server is of release 4.1.9 or higher).
Note, however, that such debugging (especially with the debug level set to 2 or higher) can introduce a substantial additional load on the server and that this load is much greater if the debug output is be transmitted via a network stream as opposed to a local named pipe.
Also note, that 'remotely' attaching to a fec makes use of whatever TINE network address security is in place at the remote host (i.e. IP address lists, but not user lists).
As a final note concerning the attachfec tool, note that a pure client process can also make use of the API call OpenIpcSocket() to provide a local pipe name (traditionally the local process id) in order to offer an avenue of investigation also using 'attachfec'. Here you would simply type for example 'attachfec <pid>' in order to have a debugging window into a running client application. This method only works via a named pipe, as pure client application will not have a systematically known debugging socket available.
VxWorks
The solution in the case of VxWorks is to run a separate task (analogous to the autoproc daemon) which accepts a remote reboot command. As VxWorks runs all tasks in the same address space, there is only one TINE server on a VxWorks CPU. All device servers are then attached to the single TINE server. Although it is possible to stop and remove the TINE server process and then reload it, the 'restart' daemon will take the more drastic step of rebooting the CPU.
Controlling a VxWorks server process amounts to starting a remote login session on the VxWorks CPU. You then have all of the task tracing functionality which VxWorks has to offer. Indeed, you are taking complete control of the CPU when you do this.

attachfec
There is no sense or need to provide a VxWorks 'attachfec' utility, as there are no local named pipes (or reason to use them). However one can make use of either the windows or java GUI executable attachfec or unix command line tool 'attachfec' to remotely attach to a running VxWorks server for debugging purposes.
Java
Java servers will make use of the native TINE watchdog servers on the platform on which they are running.
attachfec
Java has no ability to offer named pipes as a form of local interprocess communication. However, as in the case of VxWorks servers, one can make use of either the windows GUI executable 'attachfec.exe' or unix command line tool 'attachfec' to remotely attach to a running java server for debugging purposes.
Note that the debugging commands available to java servers are similar but not identical to the standard C-Lib servers.
DOS
The solution in the case of DOS is to run a separate TSR program prior to the start of the server process. This scenario is similar to the VxWorks case described above. Indeed the TSR program (slave.exe) is capable of accepting keyboard input from your host machine and returning the screen buffers so that you effectively 'take control' of the remote DOS CPU.

Worth mentioning is the fact that the slave.exe uses IPX datagrams to exchange information between the remote and local hosts. This satisfies the wish to use an independent means for communication, but otherwise appears to be a rather unusual solution. We can only say here that this solution is stable. The DOS FECs running TINE make use of the Client32 stack from Novell, which is by far the best from the standpoint of minimizing the footprint in the critical lower 640 Kbytes. Attempts at using UDP datagrams instead of IPX datagrams in the slave.exe TSR program met with only limited success, in that some CPUs crashed following a short life span. As the TCP stack for DOS has been frozen for some time and is extremely unlikely to be improved upon, this will be the state of affairs as long as DOS is needed. We could mention that TINE runs fine on DOS without IPX, so that if IPX is unavailable on a particular subnet, a TINE server would still run fine. However remote reboot would then be impossible by these means.
Win16
The solution in the case of the Win16 world parallels that in the Win32 world to some extent and makes use of a separate TINE server. Here however the ability control server processes is somewhat compromised as Win16 runs all Windows processes out of the same address space (as in VxWorks or DOS for that matter). Indeed the watchdog process has the same FEC name as all other TINE server processes on a Win16 machine. This means that in the case of a hanging server, it is unlikely that the watchdog process will be able to respond since it is attached to the same server process. On the other hand restarting or rebooting otherwise healthy processes is not a problem.
For operating systems such as Win16 or DOS where there is no virtual memory it is advisable to have an additional hardware watchdog card which will issue a cold boot in the advent of serious problems.