The current implementation of the TINE State Server consists of a machine state database repository. That is, it accepts transient change-of-state triggers, notifies the TINE Event Server of any change of state, maintains a running count of the duration of any given state (also with beam or in machine studies mode), and responds to queries as to the current machine state and current machine procedure.
An additional Alarm State Server maintains a binary indication of whether or not a particular alarm sub-system is in an alarm state (defined as having one or more active FATAL alarms. The latter can be viewed as an extension of the TINE Alarm Server.
In most respects, the TINE State server is a simple read-write server without any intermediate logic. It is nonetheless an important server in the control system, as any control system process or automation depending upon the current machine state must get this information from the state server. Similarly, the state counters maintained by the State Server make progress charts of operation history a fairly straightforward exercise.
The State Server can itself deduce state changes, based on changes in monitored parameters. However, it is advisiable to have independent state triggers from sources which have specific knowledge of a declared state change.
Specific state changes are grouped into state procedures which can be used to define machine profiles. Making use of these definitions, it is then rather straightforward to obtain a general machine overview over any particular time duration. The time spent for example, preparing or operating can be displayed, along with availability statistics (if the machine was not operating due to problems then these problems should be reflected in critical alarm states, etc.).
Thus a view of the Operation Statistcis over any given time interval can be displayed, along with such quantities as machine availability and mean time between failure.
If the representation of the machine is complete, then the operation statistics will be an accurate reflection of machine operations over any given time interval. This is alas seldem the case. To the end the TINE State Server allows corrections as well as blame assignment (a specific identification of which subsystem was responsible for specific down time).
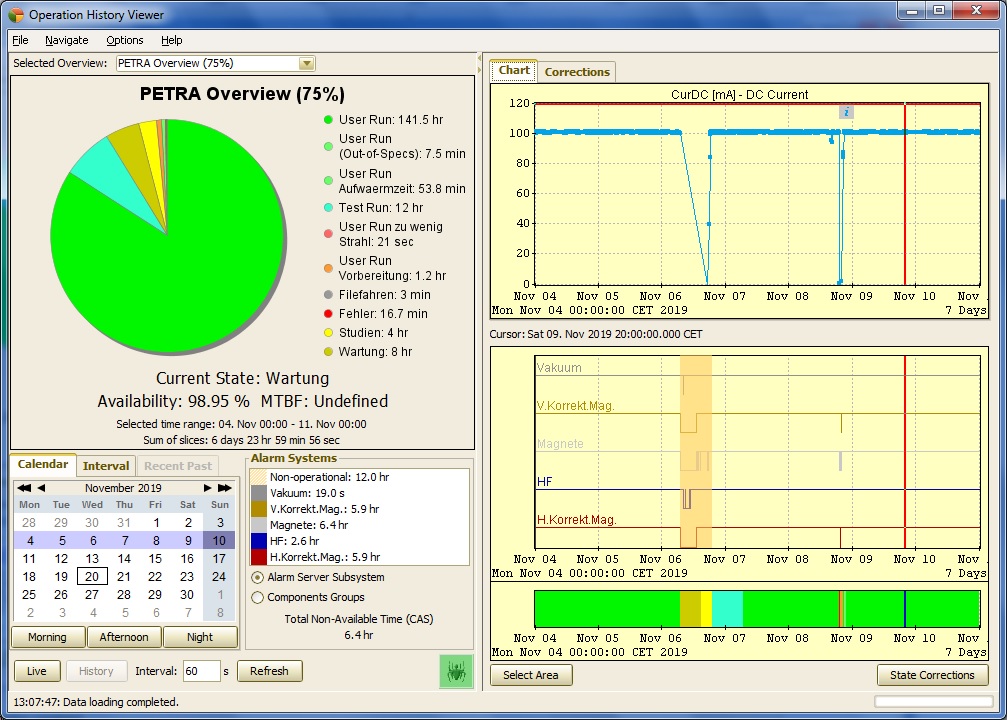
As a case in point, consider the operation history of the PETRA machine for the week beginning Nov. 4, 2019 below:
It is a fairly easy matter to archive the state counters for all of the allowed states of the machine and thus calculate the total time spent between any two time endpoints.
It this State Server model the state problems (here "Fehler") is regarded as a seperately settable state. One can see those sub-systems having given rise to problems by the not-ready binary breakdown chart. Those would be problems during the dark yellow non-operational region (Nov. 6) are not counted as problems and do not subtract from availability.
Whereas those of Nov. 9 do.
Although straightforward to set up the database to provide all of this information, it is nonetheless a challenging task to 'get this right the first time', as any newly defined state must also be fed into the central archive system, etc.
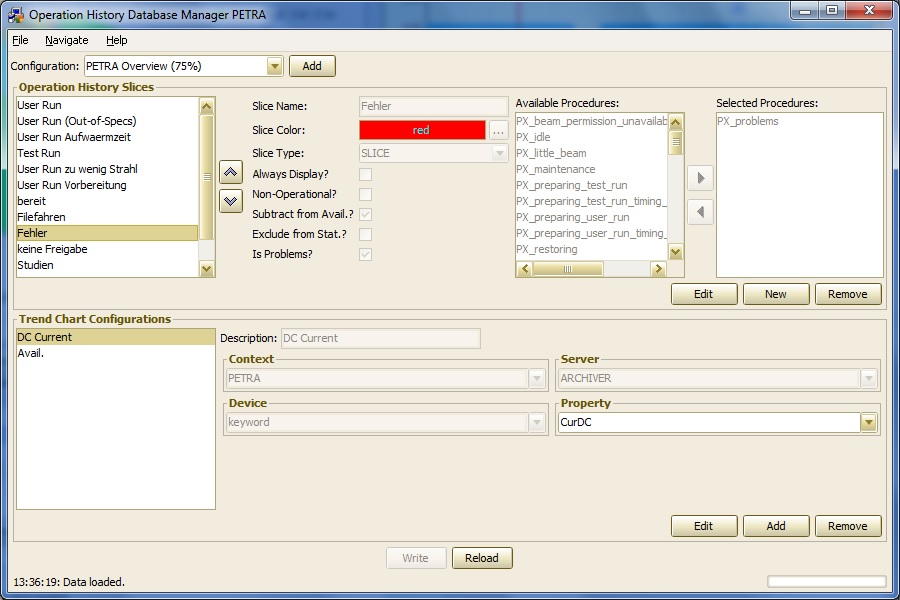
Fortunately, an 'Operation History' database manager exists which allows the administrator to add or edit the state and procedures contained in the operation profiles which are in turn composed of the states and procedures in the state server's database. The database manager also ensures that the central archiver is properly updated if necessary.