
ACOP Video Application is an application which can be used to render live image data from the tine system. The applciation requires a connection to an image server, which it then polls for data and displays an image on the main canvas.
The application also provides several different options and applications, such as color space settings, aspect ration, analysis etc. which are described in the sections below.
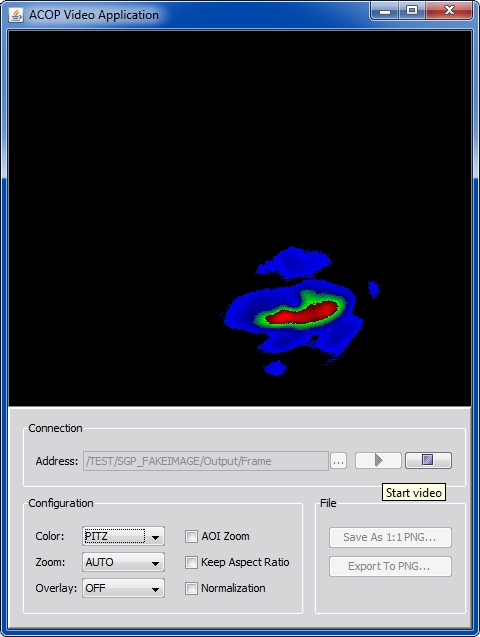
The main window of the application consist of two separate parts: the image canvas (upper part) is used for rendering the image and at the bottom of the window there are main control for the application.
Connection section defines the channel from which the application shall poll data. Enter the name of the channel (e.g. /PETRA/MDI2_Prosilica2/Output/Frame) or press the small button next to the inpout field and browse the ENS explicitly. Once the channel is selected, the PLAY and STOP buttons become available. To start the video display, press the PLAY button to stop the video at any time press the STOP button.
Configuration section provides the most common display settings. Color combo box allows selection of color map to be used on the image. The intensity of the beam in the image will be display according to the selected color map. Zoom combo box provides the option to zoom in or out from the image; there are several predefined scale factors that one can select and image will be drawn as selected immediately. Overlay combo box allows user to turn the overlay info on or off: if ON the image data will be constantly on, if OFF meta data will never be displayed, and if AUTO data is displayed on mouse over only. Keep Aspect Ratio defines if the image is shrunk or expanded to fill the entire available space or if the original aspect is kept.
The File section provides two buttons for saving the image. These two buttons are available only when the video feed is stopped. When pressing any of the buttons, user is required to specify the destination file into which the image is stored. In case of Save As command the raw image is stored (no normalization or color map is applied to the image) and in case of Export command the current snapshot is stored (any applied settings are visible on the exported image). Both commands always save the full size image.
Popup menu is also available on the image canvas, which provides some of the features mention above such as start and stop. Other common acop features are also included, such as connection info, capture screen (same as Save As) and preferences dialog can be opened, which provides several other settings.
The preferences dialog consists of 3 sections: Analysis, Connections and Video Properties.
Analysis panel provides options for on-the-fly image analysis. It is divided into three sections: Parameters, Background, and Threshold.
On the top of the analysis setting panel one can choose one of three possible analysis modes:
When remote or local analysis is selected, two side views are displayed next to the video image and certain additional markers are drawn on the main image canvas. The main analysis is done as statistical analysis of the image. The average, standard deviation, amplitude etc. are calculated using simple statistical calculation. While this method works acceptably for well defined beam shapes it fails in case of a sparse beam. The results of this analysis are visible in the canvas with red color.
Apply and Reload buttons are used only in Remote Analysis mode. When a value is changed by the user, Apply should be pressed in order to send the data to the server. If you change a value and decide that you do not want to apply it, you can reload the values from the server using the Reload button. In Local Analysis the changes are applied automatically.
In the bottom of the customizer, there is a checkbox Display Values, which opens a table that displays all analysis values:
.
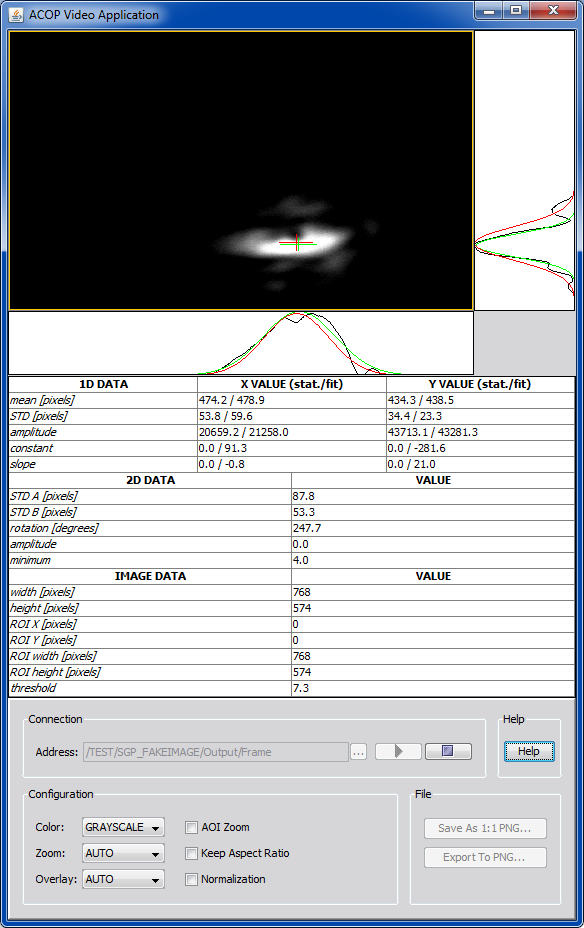
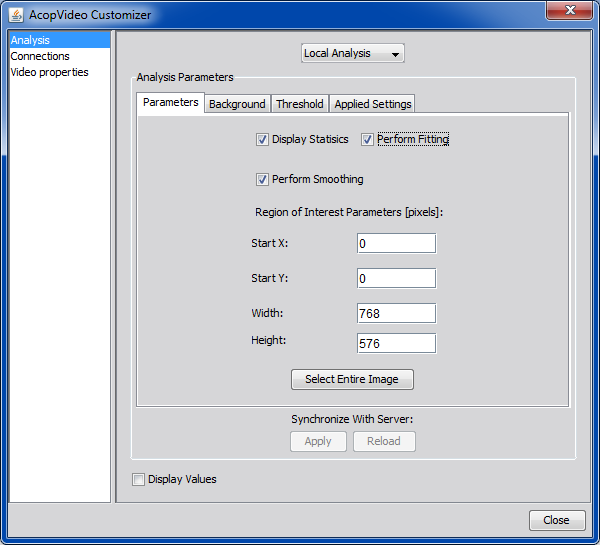
Parameters tab provide the most basic analysis options:
Threshold part of the parameters tab is used to define the threshold for calculation. The threshold is a value, which defines the lower boundary, which is still used in the analysis. Any pixel of the image, which has a lower value than the threshold, is excluded from analysis.
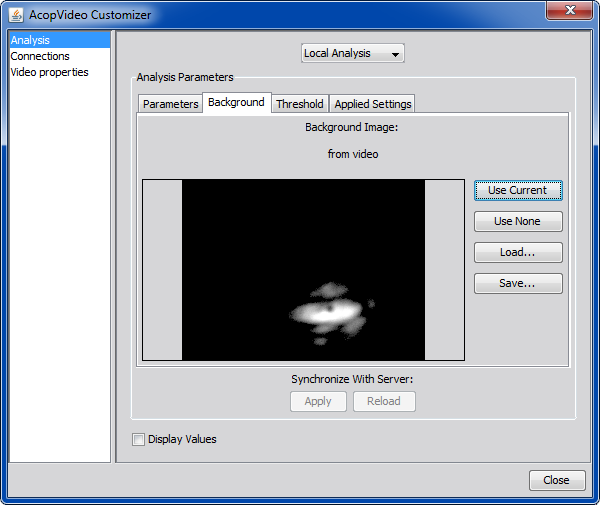
Background section provides options to select and apply the background to the current image. User is able to trap the current image as background to use no background or to select a specific image from the hard drive.
The background image is always subtracted from the real image. The subtraction is done in a ways that the live image is first converted into raw rgb values and so is the background image.
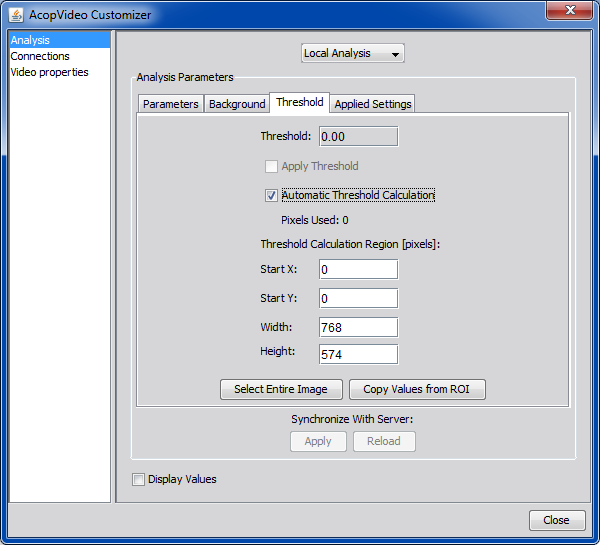
Threshold is calculated in the region marked as Threshold ROI, however the values that lay inside
the original ROI are skipped.
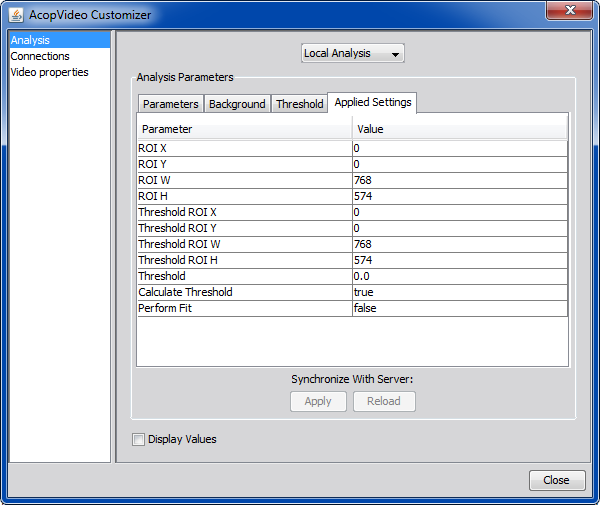
Applied settings sections provide the overview of the values currently applied on the analysis engine.
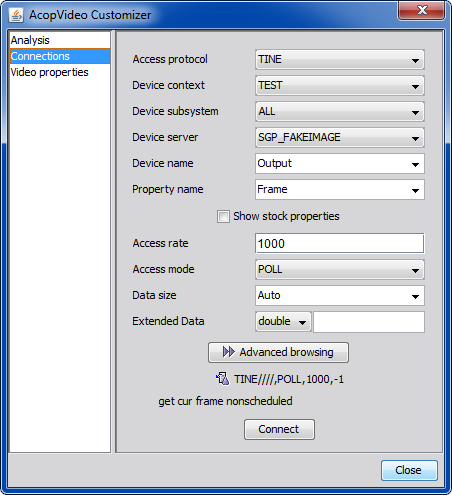
Connections section provides the ENS browser, where user can select the image channel that he wants to connect to. Access rate and mode can also be selected as well as other tine data, that is used for connection, can be specified.

Video Properties tab provides the same options as they are already available on the main screen and explaind in the Main Window section.
The current version of the analysis server does not provide all features due to unclear future
of the video transport.
Video analysis server is a tine server, which connects to a specific video feed and performs the analysis of the video image. The results of the analysis are then propagated through the properties of the device server. The server has the following properties:
When using the analysis server with the video application, one has to select Remote Analysis from the analysis customizer and then connect to the Analysis property.