LabView Programmers:
A "do-nothing" server
Start LabView and open an new project. On a new panel add "L:\LabView\lvTineSrvInit.vi" (You'll have to browse for it in the "Others" control panel).
This VI takes 1 input parameter, namely the device server export name. So set this equal to "MYSINE" and run the project.
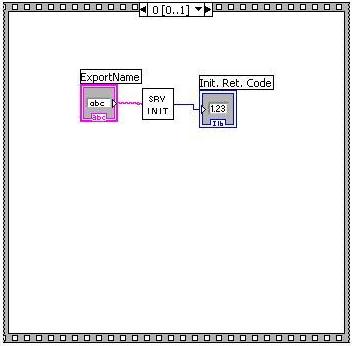
You may want to have a look at the LabView API for more details about how to use the tine VIs in LabView. You can use this VI as part of a sequence as show below:
Check the Log file (please !)
Before rushing to the Instant Client, have a look at the server's log file. This will be called 'fec.log' and should be located in c:\tine\log (if that's where FECLOG is pointing to!), or directly in the working area, if there's no FECLOG environment.
Near the end of the log file you should see a message saying that your equipment module was "registered with equipment name server". If you see this then everything went reasonably well so far.
Browsing your server
Now try to find your server in the Instant Client under the context name you assigned. You will more than likely need to click on the "Reload Names" menu item under options (if the context itself is new) or at a minimum open up and close again the context combo box (this will force a reload of the names under the given context).
You should see your device server and be able to browse the properties and devices you entered in the setup wizard.
You should be able to read a lot of '0' values (not very interesting).
A "do-something" server
So let's give the properties something to read back.
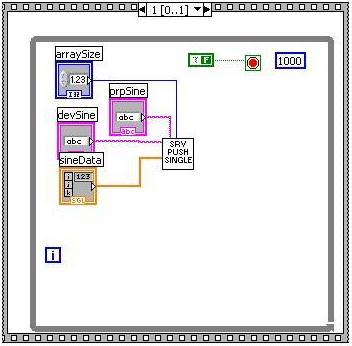
You'll need to call one of the "push" VIs in a loop in order to test this. For instance, you can make use of the lvTinePushSingle.vi where you specify the property and device whose data you want to change and for the sake of an example, attach a random number generator.
This could be in the second frame of the sequence used above as shown below:
Restart your server and see that the properties return something.
Adding device names
Unless you thought in advance while using the server wizard, there are probably no device names registered. The instant client will just show a "#0" as a device name. You can re-visit the wizard and enter "100" for the "Number of Devices" (in the device server information frame).
After entering this number, click on the Property Name field, that will signal the wizard to fill in the Device Panel with some device names ("Device 0", "Device 1", etc.) which you can either just leave as it is, or provide some of your favorites.
Also let's specify what kind of array property "Temperature" and "Sine" are.
Click on Property "Sine" in the display panel on the right hand side, so that all of the text and combo boxes are filled with it's parameters. Now for "Output Array Type" choose "SPECTRUM". And click on the "Edit" button on the right (If you try to "Add" this property, you'll get a message telling you it is already there, but you can edit it!). Click on property "Temperature" on the property display panel and choose array type "CHANNEL". And then click on "Edit" again.
When you're finished, click on "Done" once more.
If you have a look at the new generated "exports.csv" file, you should see that the number of modules is now 100, and the format type for property "Sine" is now float.SPECTRUM and for property "Temperature" float.CHANNEL.
Channel versus Spectrum Arrays
Copy this new exports.csv into your FECDB database area and restart your server.
Now when you browse for it with the instant client, you should notice that when you click on property "Sine" the display type automatically changes to "PolyLine", i.e. a SPECTRUM data type automatically gets displayed as a trace.
- Note
- you should open up and close the Device Server Combo Box on the instant client, before you re-browse for your server. The reason is that the instant client will cache the property information for a server and not know about the array type changes you just made unless you force it to re-acquire this information.
Click on the "Temperature" property. The display type automatically changes to "Histogram", i.e. CHANNEL array data generally refer to an array where each element refers to value of the property for a particular channel. And this is best displayed as a histogram.
If you make the instant client read the Temperature, you will also see that the x-axis label also includes the device names and the element positions.
- Note
- When a property returns a spectrum array (also known as a waveform or trace), it usually has x-axis units as well as y-axis units. (Voltage versus time for instance). The Wizard currently doesn't have room for x-axis units, but you can add it by hand by editing the export.csv file yourself. You need to find the description of the property in question (for instance "Sine" in our case). And instead of "[-500:500 V]Sine Curve", you would expand it to read for instance "[-500:500 V][-100:900 usec]Sine Curve". A client program reading this information would then know how to position the min and max settings for the horizontal axis as well as what the x-axis units are. HOWEVER: only make these kinds of changes when you're finished using the server wizard, otherwise you'll have to copy-and-paste them back in.
Before leaving the server wizard, let's have a look at local history files (followd by alarm files). Use the wizard to call up your database again and select the Temperature property. Now check the "Keep History" check box, followed by clicking the "Edit" button and then the "Done" Button. You can also edit the history panel if you wish. The default settings should be good enough for our demonstation purposes.
Local histories
You should have generated a "history.csv" file, which you can now copy to your FECDB area as well. Now restart your server and have a look at the log file. It should now tell you that it is keeping a history of "Temperature". If you re-browse your server in the Instant Client, you should see a "history" check box appear, which will let you trivially check the history of the selected device. A better way to see what is going on, is to add by hand ".HIST" to the property name in the combo box (make sure the history check box is NOT checked), and then hit the read button. Without any further input the local history server will ask for history data starting from "now" minus the depth in seconds given by the data size in the request. You can also have some fun by repeating the call with a format type of "FLTINT" which will return an array of data-timestamp pairs.
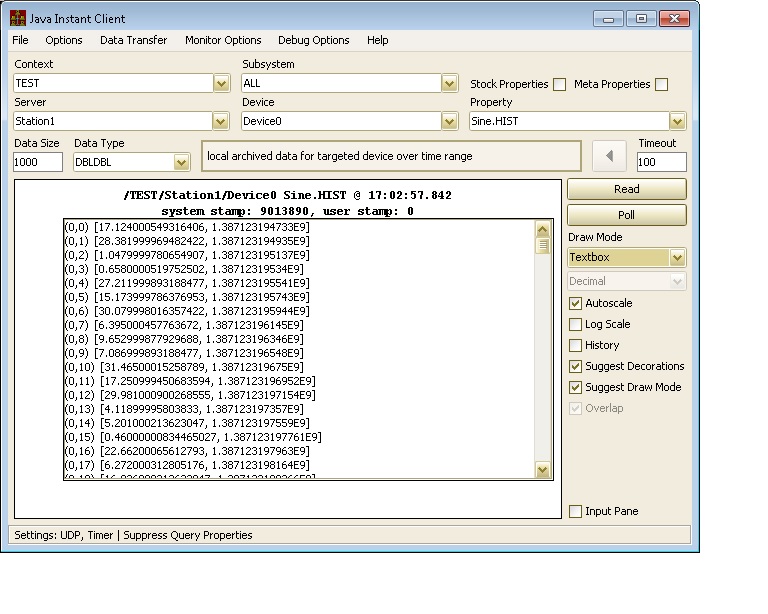
If you want to hava sneek preview of the local history viewer, you can call it up and under "Options" choose "Data Sources" and then choose the "LOcal History Chooser". You can then navigate via the Context combo box to the "WORKSHOP" context and find your server. It should display everything you are keeping a local history of. Choose one of your properties and devices and the click on "Add Selection".
Local Alarm Server
Now lets have a look at the local alarm system. Start the wizard again, select "Temperature" and check the "Alarm Watch" check box. You should change some of the settings in the alarm watch panel, namely the "Value too high" Threshold, you can set to 24, with a warning at 22 and the "Value too low" threshold to 16, with a warning at 18. Click the "Edit" button and then the "Done" button.
You should now have generated an "almwatch.csv" file. Have a look at this file (if you like) and copy it into your FECDB area and restart your server.
You can check the alarms on your server via the instant client, by including the "Stock Properties" in the property list. The relevant properties are "NALARMS" (number of alarms as a 5-parameter snapshot - when the first number > 0 then you have local alarms) and "ALARMS", which will return the current local alarm list (you might want to ask for fewer then the default 512 alarms).

Another simple way to view the alarms is to start the Remote Fec Control panel, find your server and click on the Alarms tab.
Commands (changing settings)
Now let's see how we can set the amplitude. So far we can only read it. Use the server wizard to make sure that the "Amplitude" property is a READ/WRITE property. Click on the "Amplitude" property in the right-hand side display, change the access to READ/WRITE and make sure the input parameters allow 1 float (Single) values to be sent. Click on "Edit" and then on "Done". Copy the new exports.csv file into the FECDB area.
We're not through! Now a client will send us data, so we have to examine what was sent, decide whether to use it or not and then return.
In LabView, you accomplish this by using the lvTineWaitCmd.VI. When input arrives this VI will fire a LabView occurence, at which point you can call lvTineSrvPullSingle.VI and lvTineSrvPushSingle.vi. See the documentation under the LabView API in the tine web page for more details. Basically you will should utilize another sequence in another form (which will be another thread) where the lvTineWaitCmd.vi is contained in the initial frame. You should have one of these for each property which corresponds to a command. Below is an example for a property "MODE"
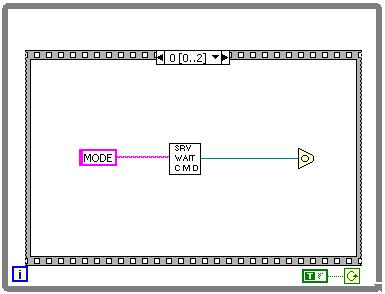
The following frame in the sequence will only be accessed when the occurence fires.
You shoule pull the associated data in this frame, examine its contexts and decide whether to accept the command or not, and if accepted you should push the data into the output buffer.
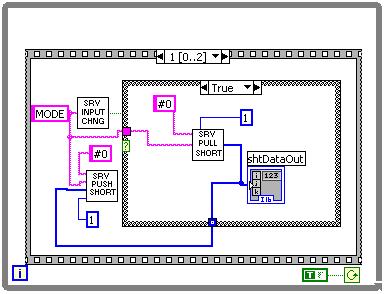
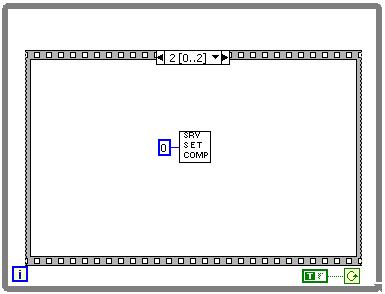
Finally, you should set the completion of the transaction and return to the waiting state in the initial frame.
Property Scheduling
You may be wondering what the prpScheduleFlg parameter does in the LabView Push VIs.
This is a scheduling flag. If you pass "TRUE" here, it calls the TINE scheduler, which has the effect of notifiying all clients listening to the property in question immediately. That is, NO LATENCY.
To test this, set this flag to True.
Now recompile and restart your server and poll the property in question with the Instant Client, BUT .... pull it with a polling interval of 30000 msec. Ordinarily, you wouldn't expect data updates any faster than once every 30 sec. But you'll be updating whenever the value changes at the server, no matter what!
device-oriented versus property-oriented
Most classic device servers have many instances (devices) and each device supports the same set of properties. Many servers however are more "property-oriented" than not. Still others are more "device-oriented" than not.
Property-oriented would mean that each property potentially has a completely different set of devices. This is typical of middle-layer gateway servers, where there might be a property "VacPressure" and a property "Orbit-X". The getter pumps in the one case have nothing to do with the bpm monitors in the other.
The wizard is capable of setting up this kind of behavior in the configuration database. That is the purpose behind the Server or Property option button in the device panel. The default is "Server-oriented" device lists, where the devices given are valid for all properties on the server. If you select "Property", then a separate list is made specifically for the property in question. If you try this, you will generate an addition .csv file with the name <Property>-names.csv. In our case, "Temperature" might be such a property, so you would generate a Temperature-names.csv. (Of course if everything is called "Device 0", etc. you won't see the difference.
Device-oriented would mean that the device server supports all devices listed, but some devices might have a different property set than others. The wizard is not capable of setting up the Device-Oriented behavior, but you can add it yourself (fairly) easily.
You need to modify your <eqpmod>-devices.csv file. For instance, if this is called MYSEQM-devices.csv, it might look like:
You need to add by hand another column called PROPERTY_LIST. If the device in question deviates from the default property list (all registered properties), then you need to supply a file name (your choice) for the entry in this column. For instance, let's say that "Device 3" only supports property "Temperature". Then you would have:
- Note
- The above editing might be easier in Excel.
Then you need to create the file called Device3-properties.csv. This is a .csv file with one important column, namely "PROPERTY_NAME".
So you would have
And that would be that.
- Note
- You can't do both! Your server is going to be classic (one device list, one property list) or it is either device oriented or property oriented.
Once again, when you start editing the .csv files yourself, you'll probably want to stop using the wizard (or else get used to copy-and-paste.
Redirection
It's time to try Redirection. The wizard doesn't offer this, but you can do it again by hand.
Often it is the case that a server will offer a property which lives on another server, or a device which lives on another server.
Let's look at the device case first. Suppose you want to redirect any request involving Device 1 to your neigbor's server. Ask your neighbor what his server is called. Open up the <eqpmod>-devices.csv file and add a column called REDIRECTION and leave all the entries in this column blank except for the row corresponding to Device 1. In this row, put your neighbor's server. For example, if his server is called "MYNEIGHBORSERVER",you might have:
Copy this new -devices.csv file to your FECDB area and restart your server. When you (re)browse your server and access Device 2, your call will be redirected to MYNEIGHBORSERVER.
ONE IMPORTANT THING: If the "MYNEIGHBORSERVER" Server isn't running or doesn't have a device namded "Device 2" or a property equal to one you're trying to access then you will get an error code returned.
 1.5.8
1.5.8